Built for e-commerce teams that want clarity, not complexity
All the analytics power you need, without the enterprise overhead. See what's working, understand why, and know what to do next.
Overview
One overview for every channel
Revenue, orders, ad spend and traffic from every platform you use, side by side.
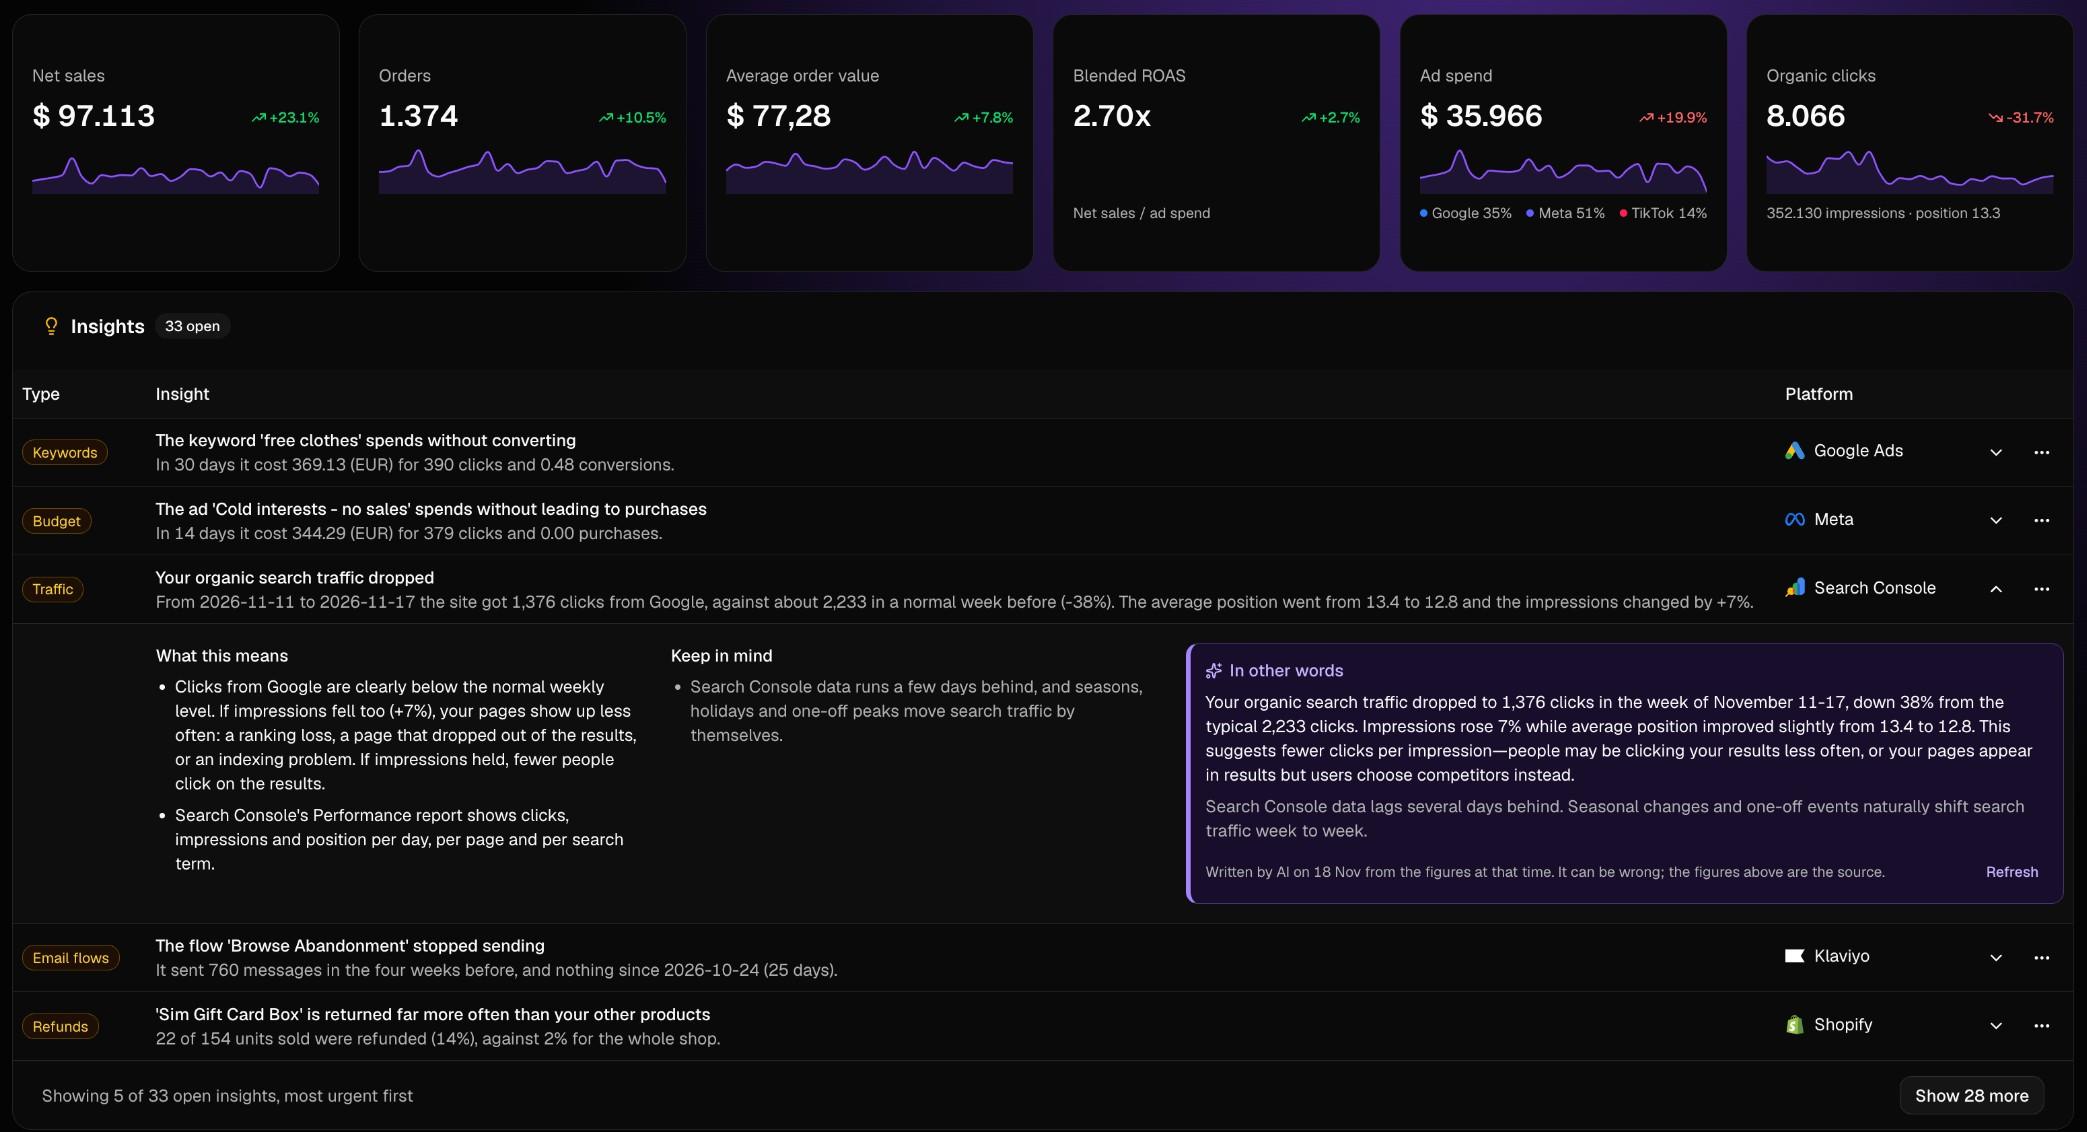
KPIs at a glance
Net sales, orders, average order value, blended ROAS, ad spend and organic clicks, with the change versus the previous period.
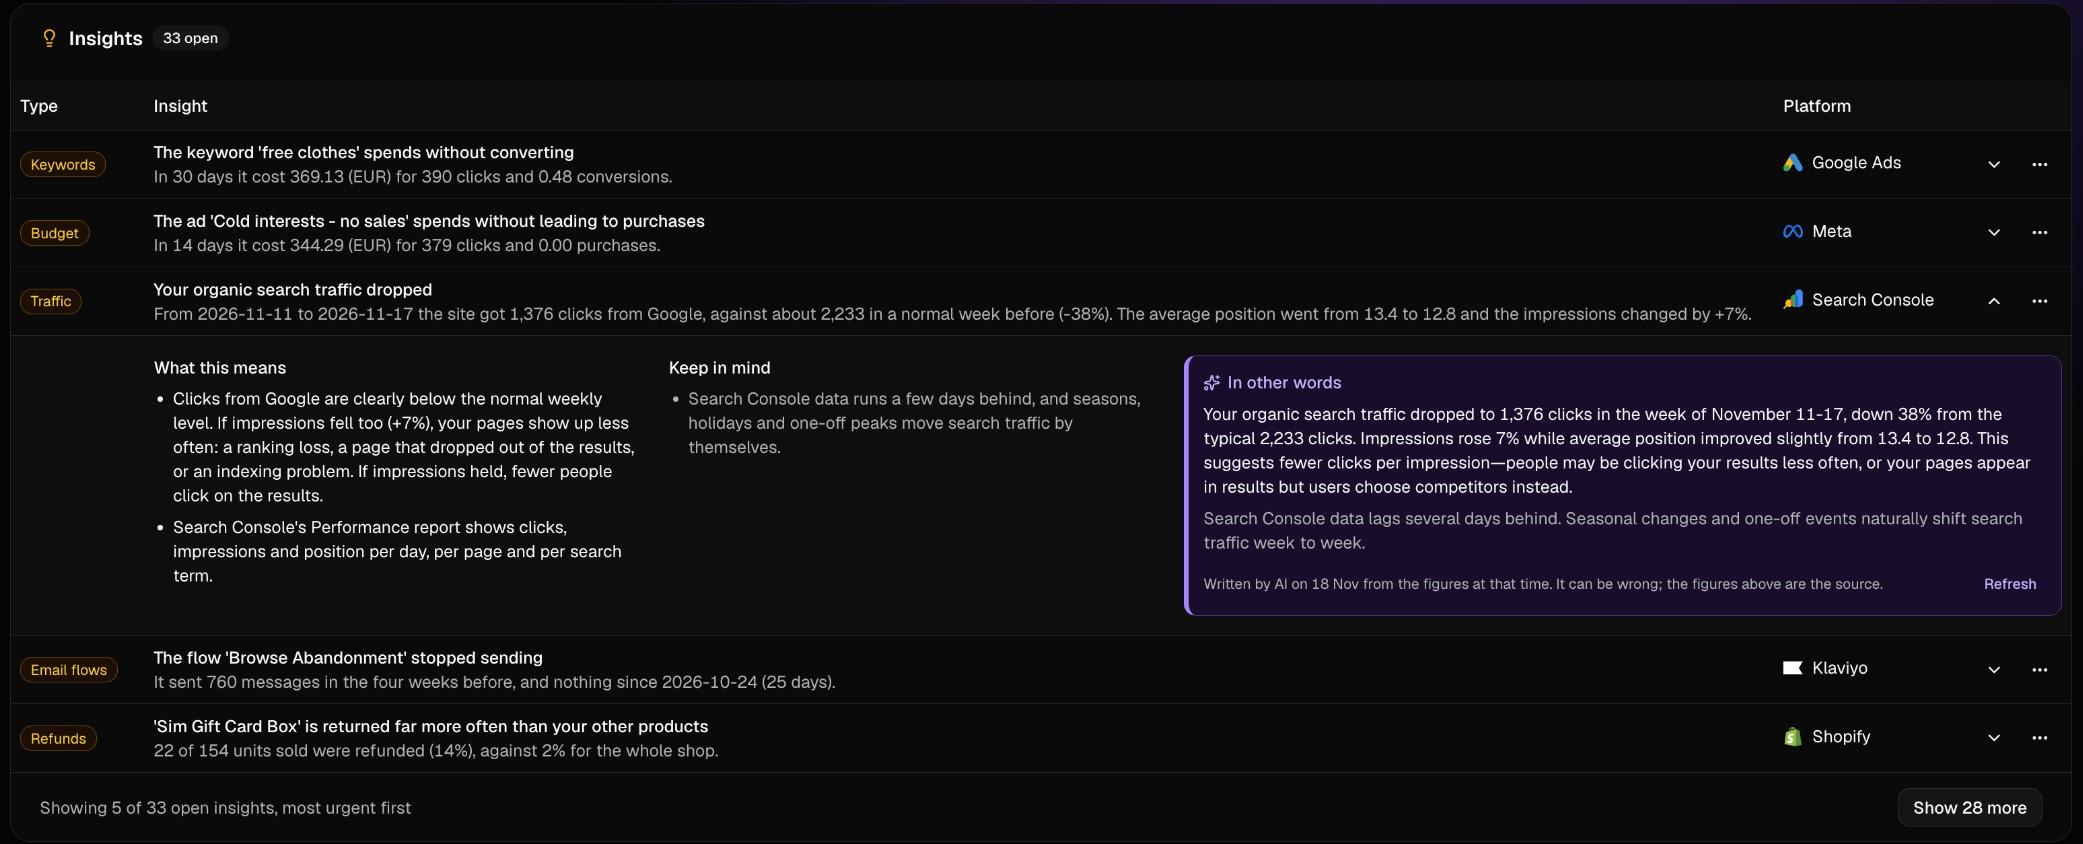
Insights on top of the numbers
Automatic checks list what needs attention, most urgent first, right below the KPI tiles.
Revenue next to ad spend
A daily trend of net revenue and ad spend, split by channel when you want to dig in.
Top performers
See what brings in the money
Your best search queries, campaigns and emails, and the ads and posts that perform, on one page.
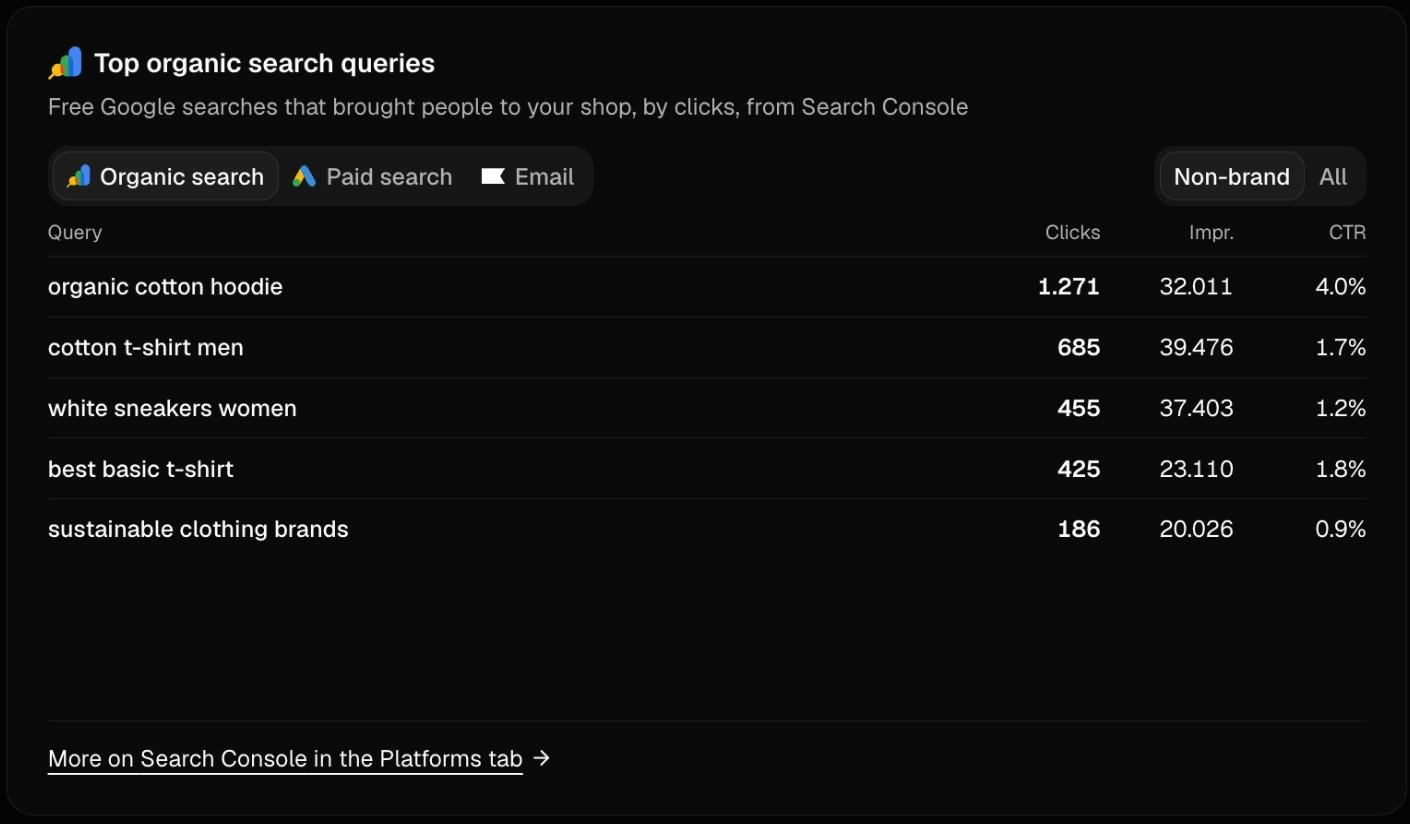
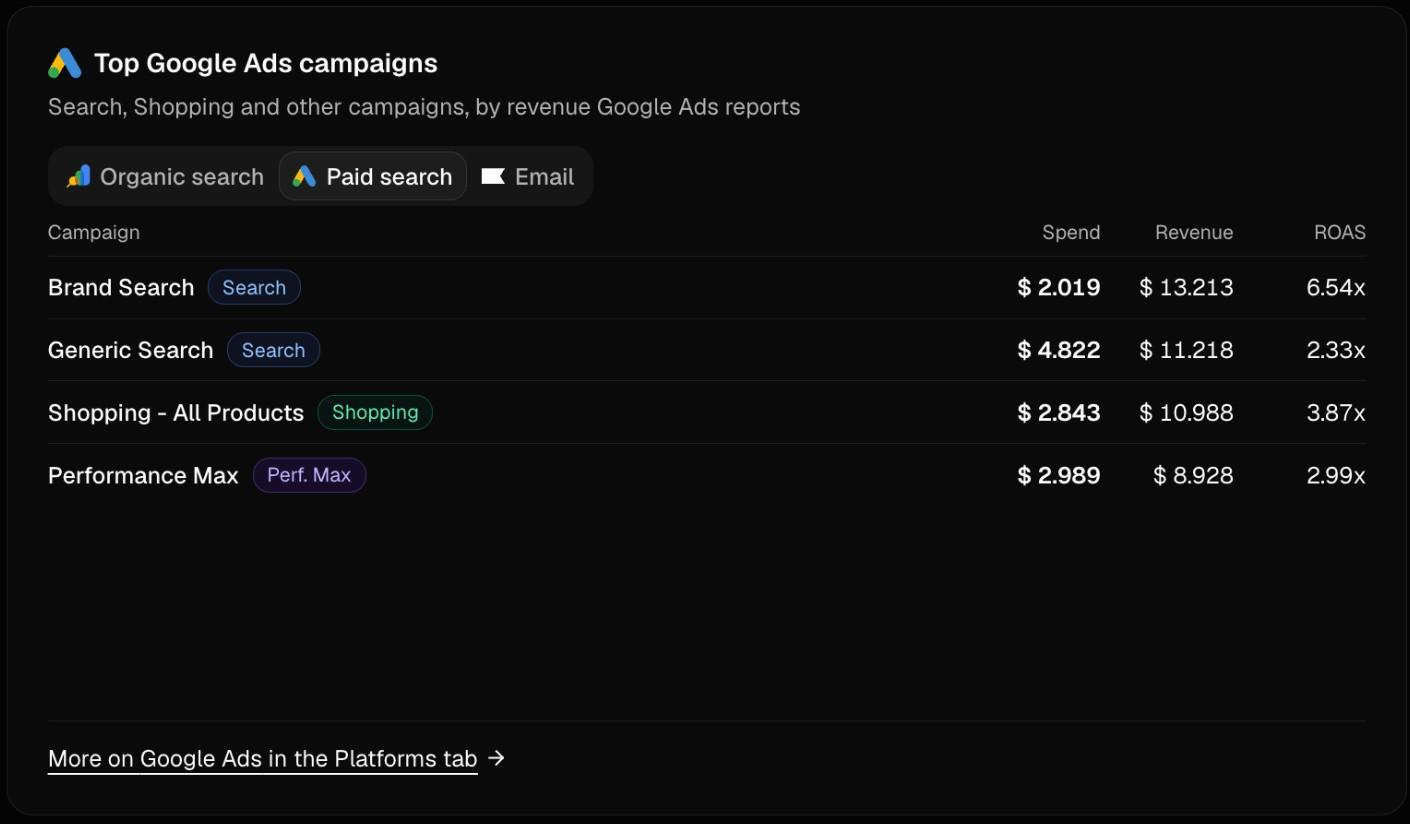
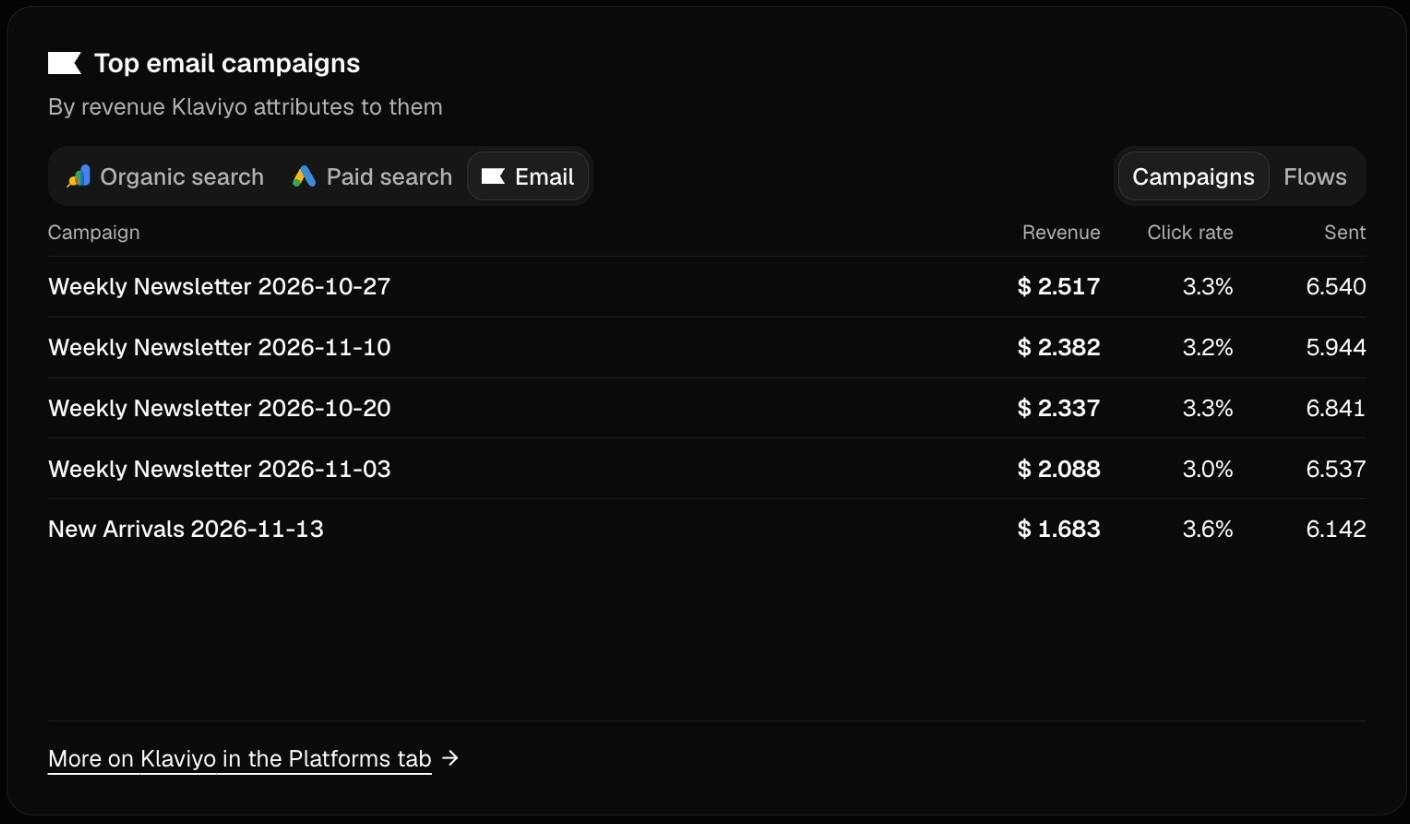
Organic search, paid search and email side by side, from Search Console, Google Ads and Klaviyo.
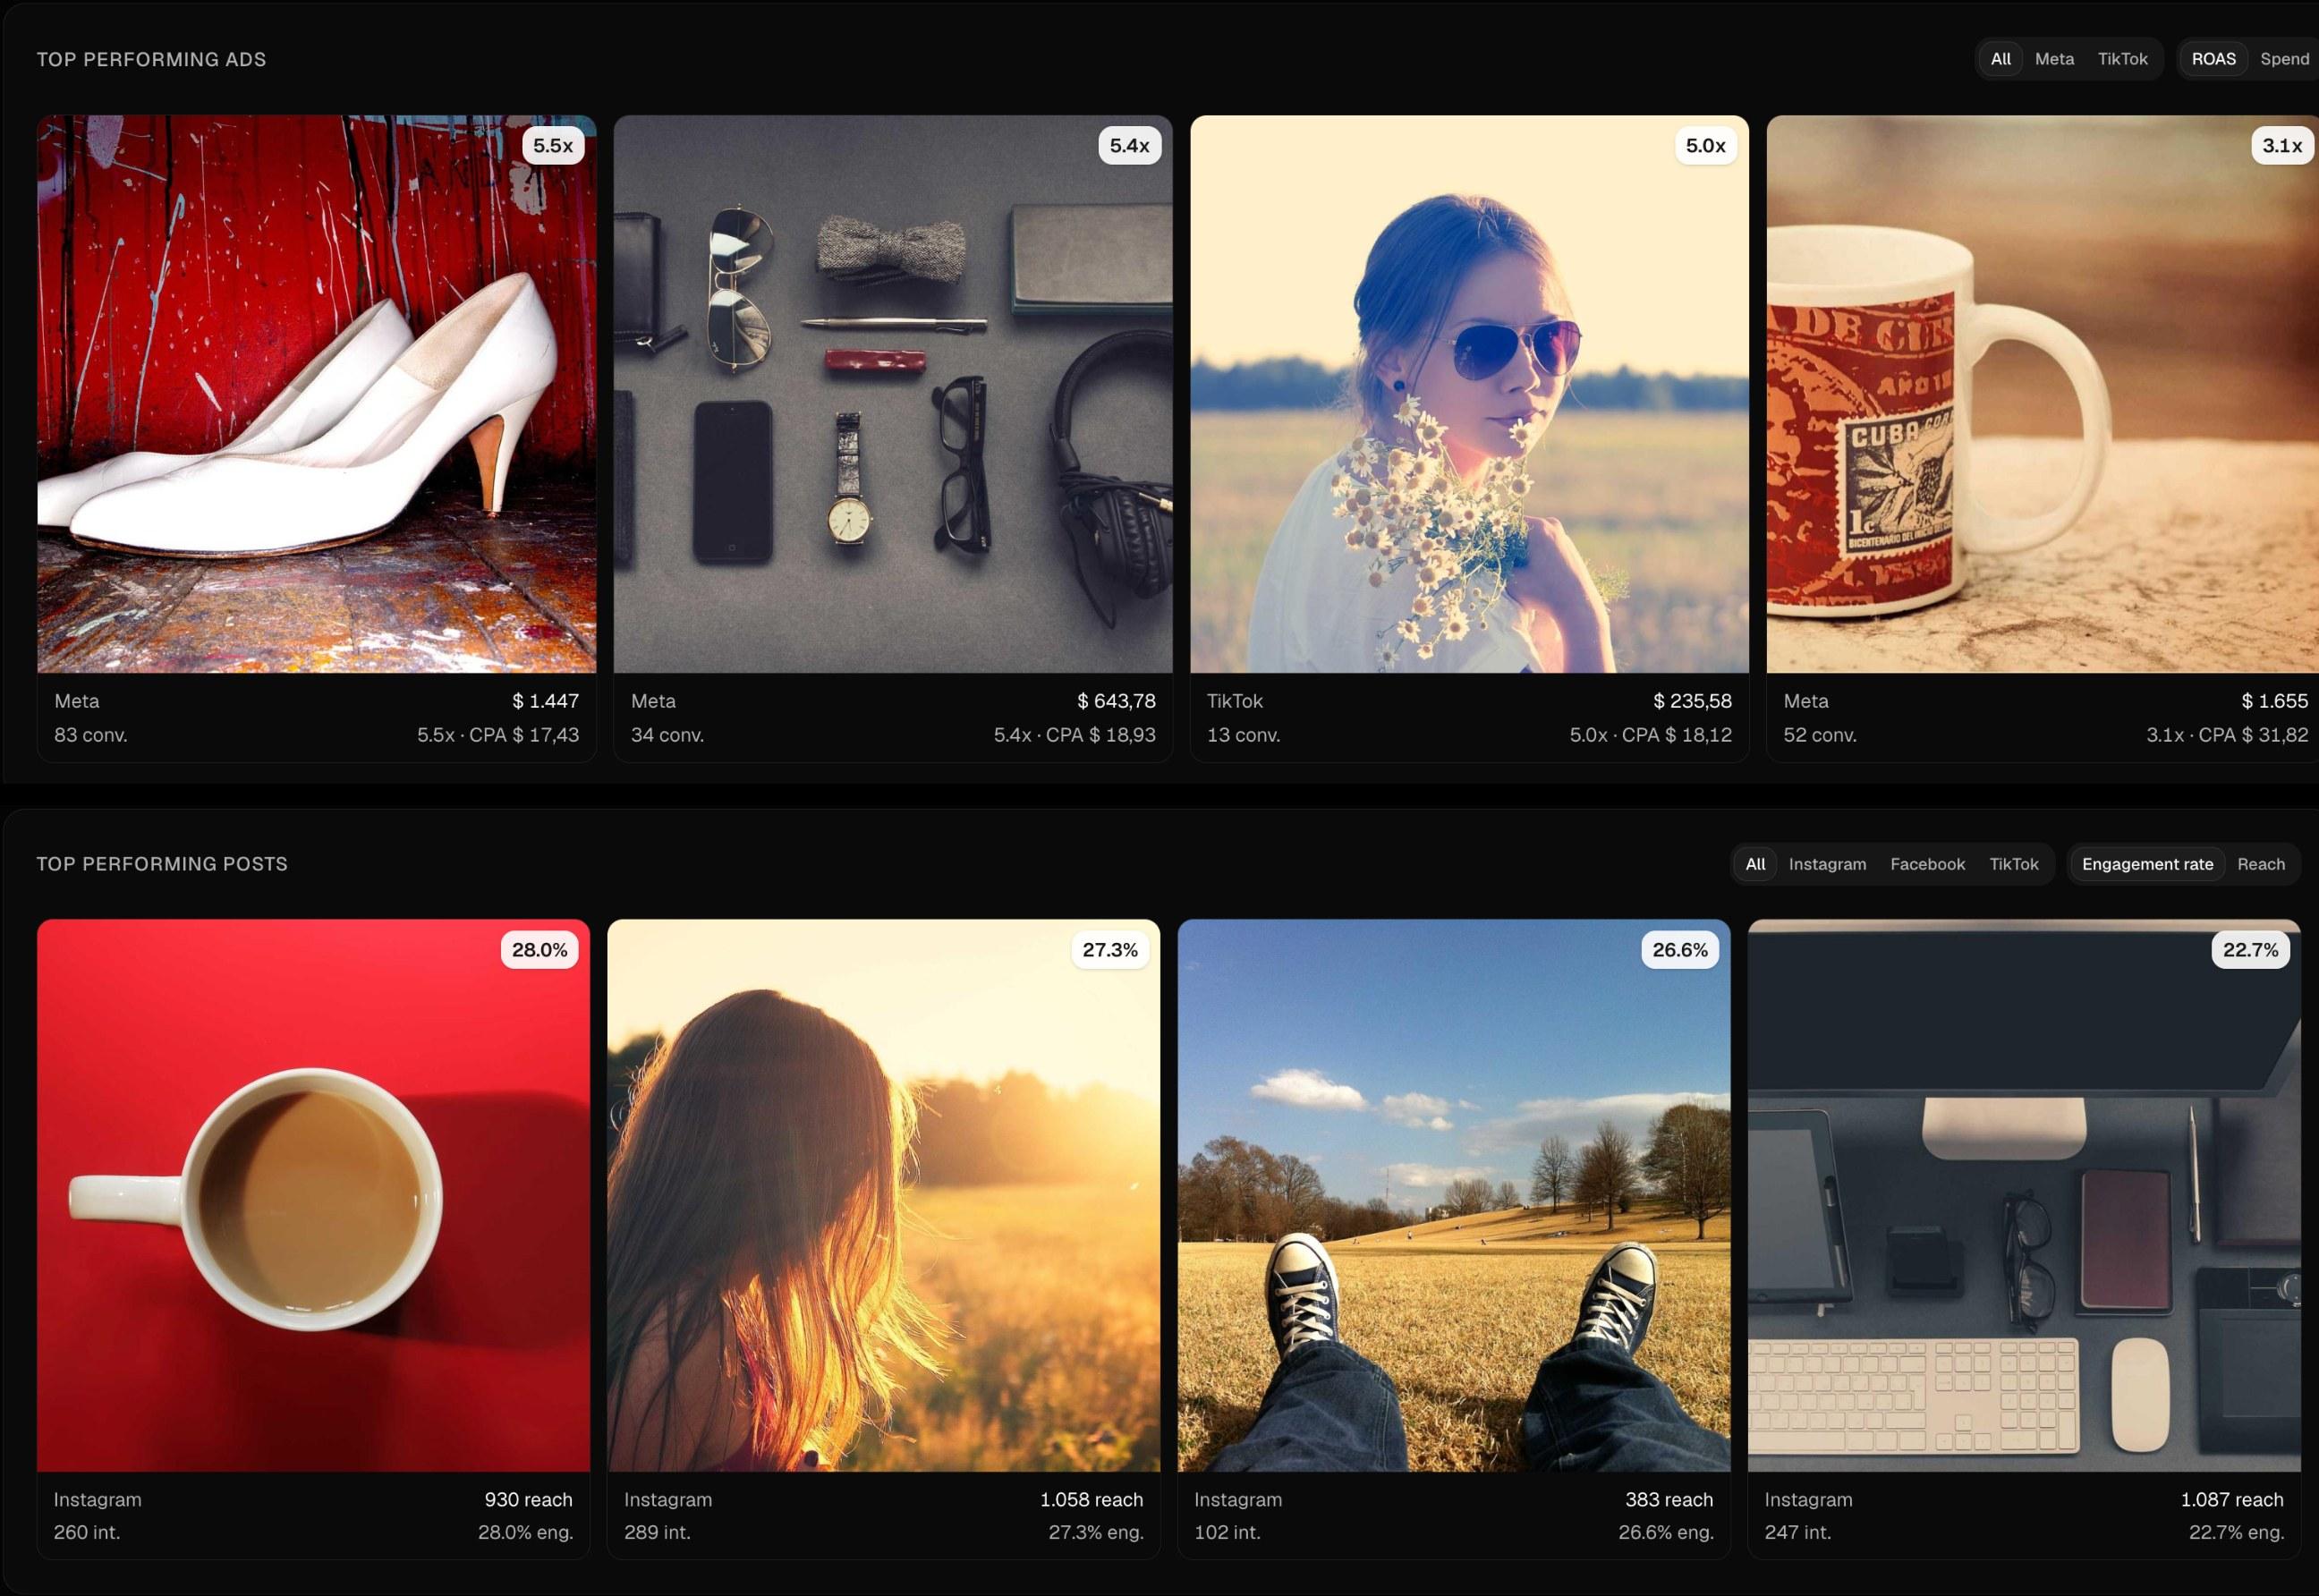
The creatives behind your best ads and posts, ranked by ROAS or engagement (demo data).
Insights
Know what to fix and what to scale
Baseboard checks your connected platforms every day and lists what needs attention, most urgent first. Each insight is a problem, a measurement gap or an opportunity, with the numbers behind it.
- Problems: keywords and search terms that spend without converting, ads that stopped delivering, email deliverability and spam complaints
- Measurement gaps: tracking that stopped or auto-tagging that is switched off
- Opportunities: campaigns worth scaling, rising search queries and pages close to page one
- Across Google Ads, Meta, TikTok, Shopify, Klaviyo, Search Console, GA4 and Clarity
Blended metrics
Know what your advertising really returns
Every ad platform reports its own numbers. Baseboard puts them next to your real store revenue, so you see blended ROAS and customer acquisition cost across all paid channels.
- Blended ROAS and CAC across Google, Meta and TikTok
- Spend, revenue, clicks, conversions, CPC, CPM and CTR per platform
- Platform-reported numbers shown separately, so you can compare
Blended ROAS
3.71x
CAC
$48
Platform-reported figures next to your blended numbers.
Shopify
Net sales you can trust
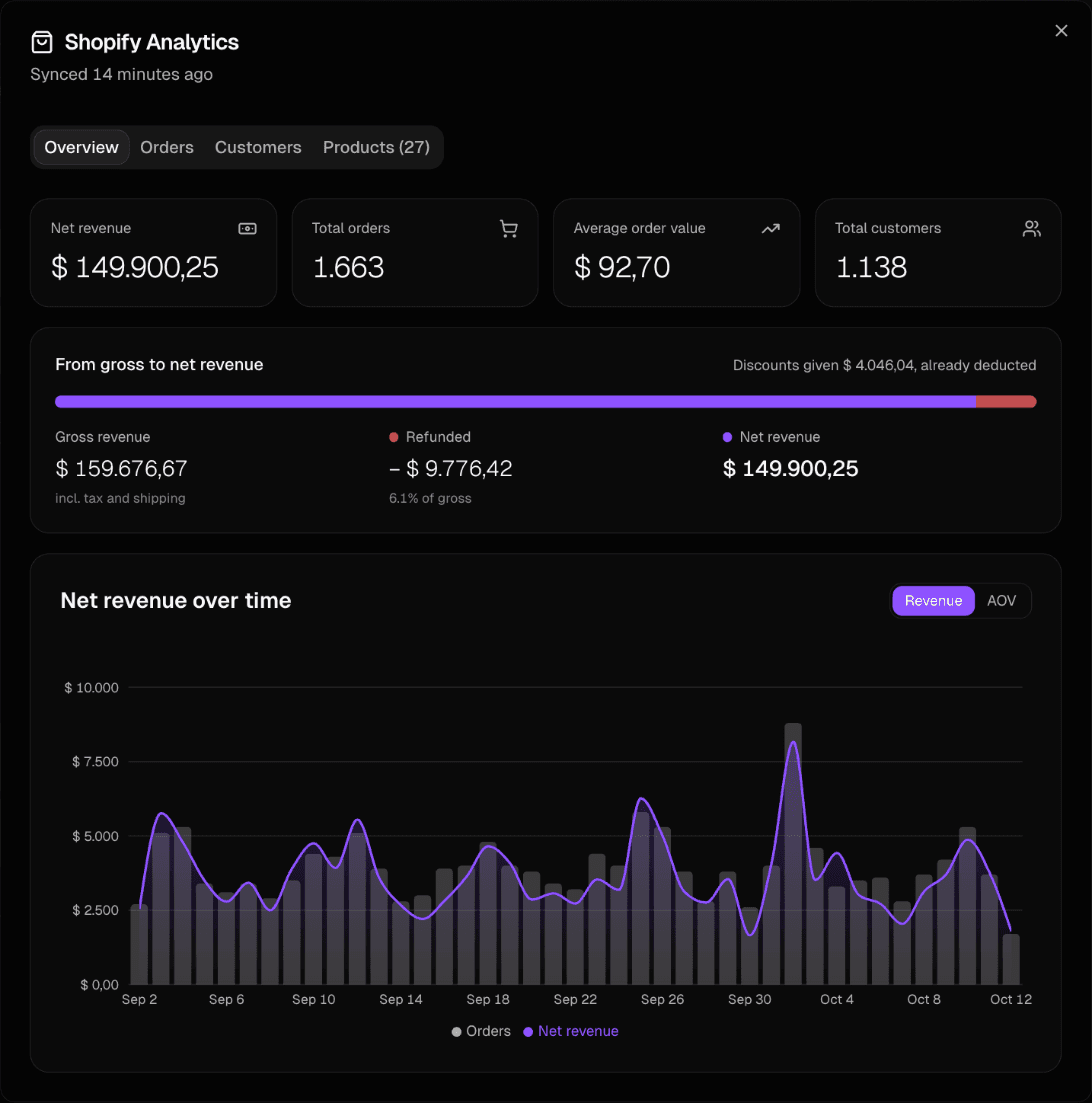
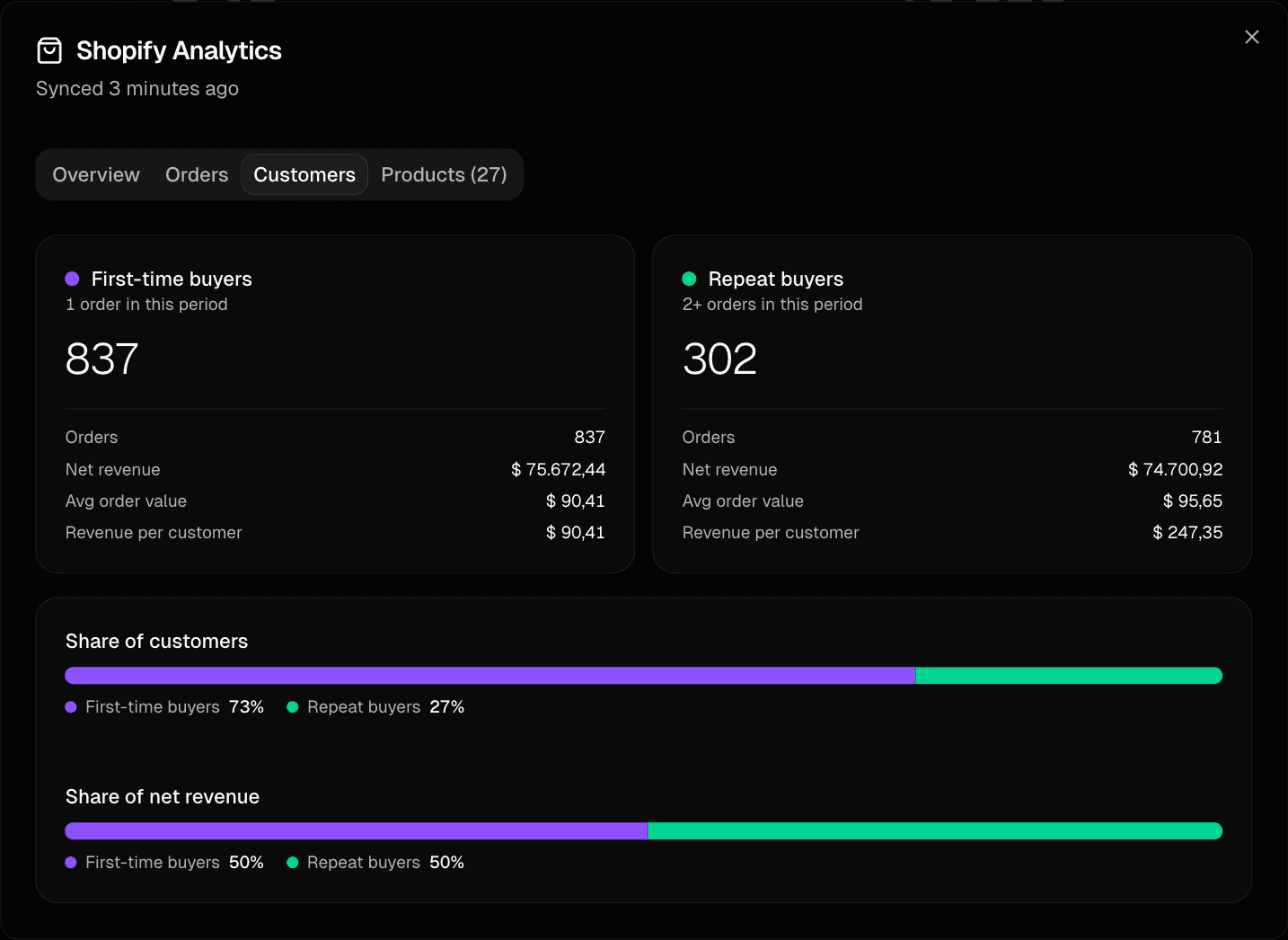
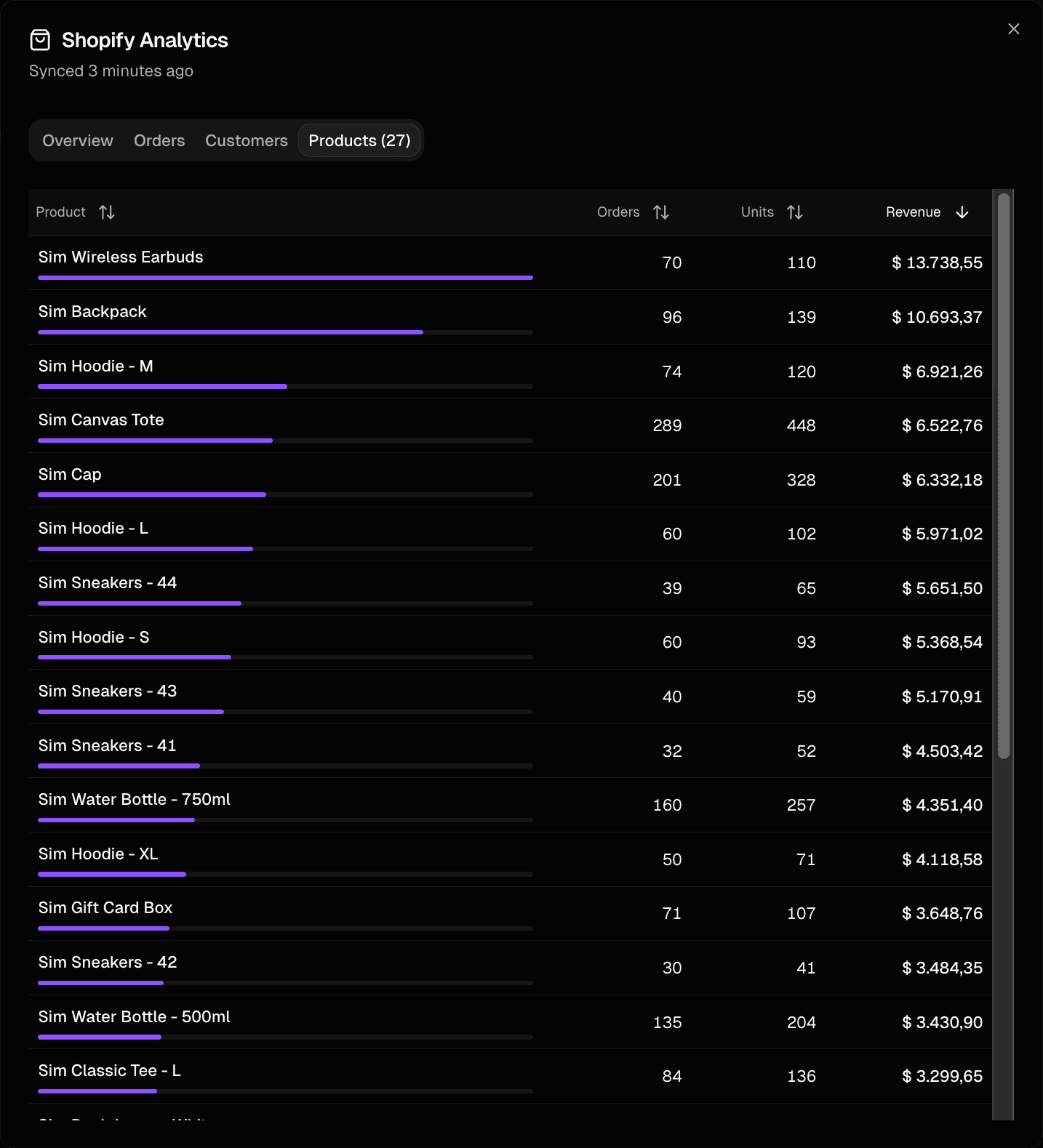
Baseboard reads your orders straight from Shopify and reports net sales after refunds, in your shop's own time zone, so the numbers line up with what you see in Shopify.
- Gross revenue, refunds and net revenue in one clear breakdown
- Net revenue over time, with order counts alongside
- First-time versus repeat customers, and what each is worth
- Your best-selling products, ranked by net revenue
Order insights
Know what happens after the order
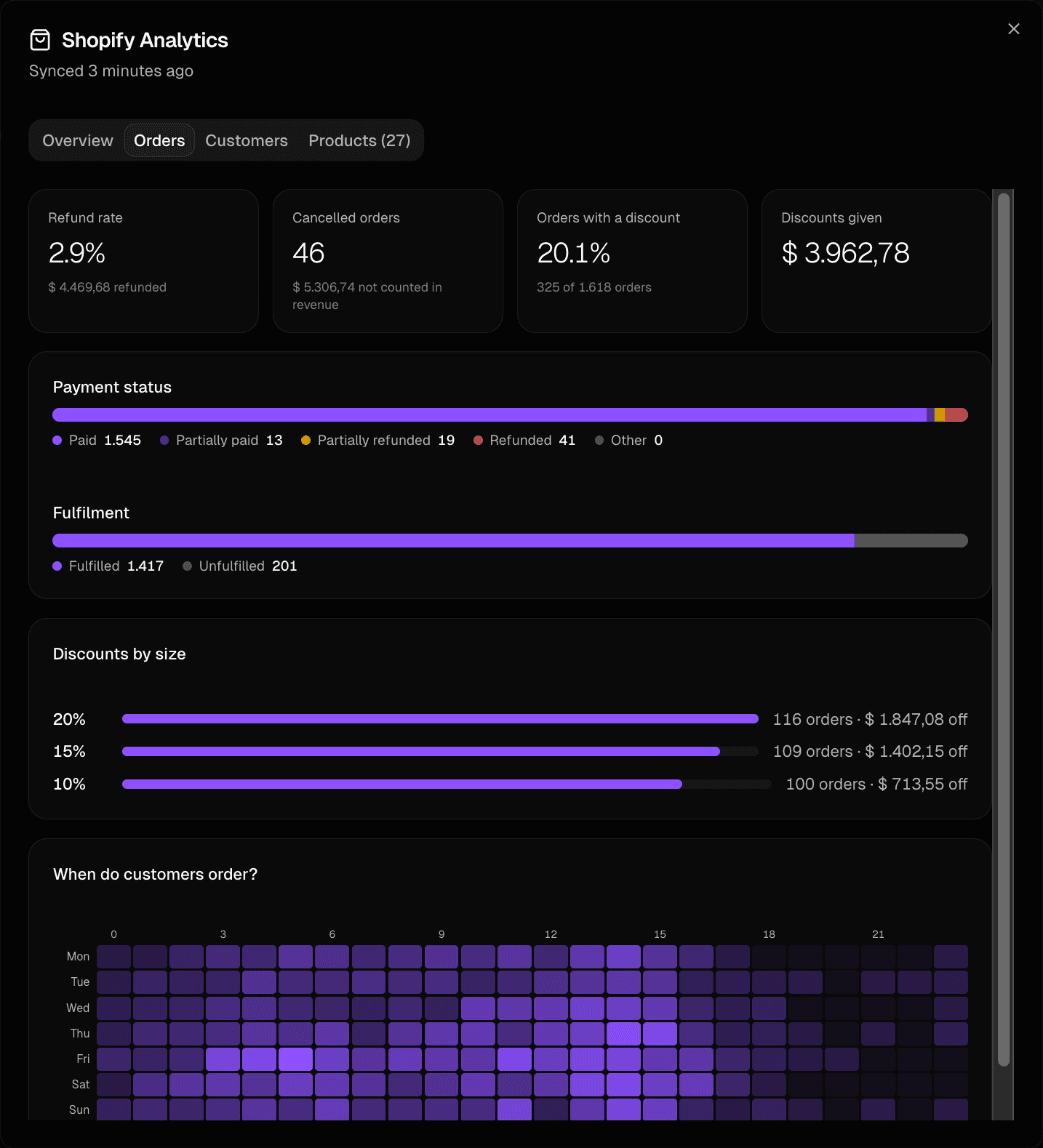
See how many orders get refunded, cancelled or discounted, and when your customers actually buy, so you can plan promotions and staffing with real data.
- Refund rate and cancelled orders, with the value they represent
- Payment and fulfilment status at a glance
- Discounts by size: how many orders and how much you gave away
- A heatmap of the days and hours customers order
Organic social
Paid and organic social in one place
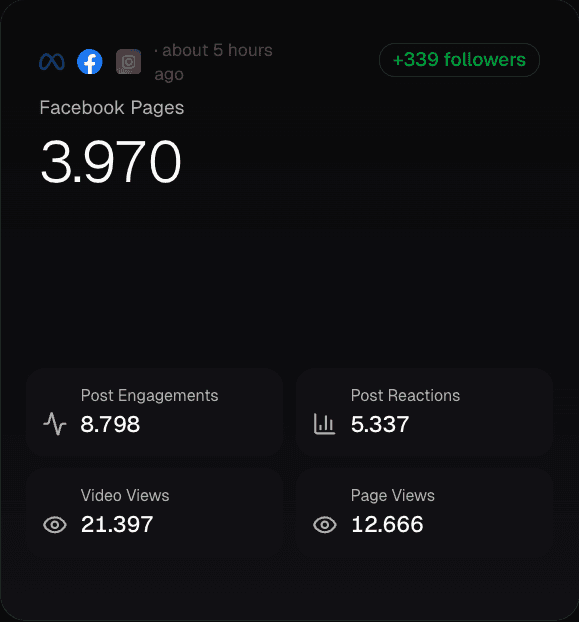
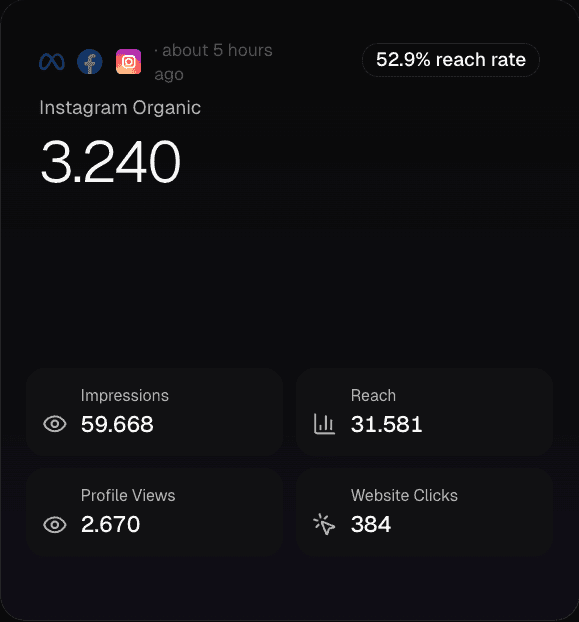
Your Facebook Page, Instagram account and TikTok videos sit next to your ads, so you see what your organic content adds without opening three apps.
- Facebook Page: post engagement, reactions, video views, page views and new follows
- Instagram: impressions, reach, profile views, website clicks and contact taps
- TikTok: organic video views, likes, comments and shares, plus followers
Channels
Drill into every platform
Start with the overview, then open any channel for the detail behind the number.
Shopify
Orders, customers, products and net revenue
Google Ads
Spend, ROAS, campaigns and ad sets
Meta Ads
Spend, ROAS, campaigns and ad sets
TikTok Ads
Spend, ROAS, campaigns and ad sets
Google Analytics 4
Sessions and traffic per channel
Klaviyo
Campaigns, flows and email-attributed orders
Google Search Console
Organic clicks, queries, pages and positions
Microsoft Clarity
Rage clicks, dead clicks and other friction on your site
Shops and teams
One account, every store
Switch between shops in one click, and every number on screen follows the shop and ad account you picked.
- Connect several shops and switch between them
- Choose which ad account is active per platform
- Invite teammates and give them a role
- Reports follow each shop's own time zone
Main store
Reports in Europe/Amsterdam
Second store
Reports in America/New_York
Active ad account
Main store - Meta Ads
Made for daily use
Make the dashboard yours
Pick a date range, compare it with the previous period and choose the look that suits you.
- Dark and light mode
- Your own accent color across the whole app
- Date ranges with a comparison to the previous period
Accent color
Dark
$149.8K
Light
$149.8K
15 min
Shopify stays fresh
Orders and revenue refresh every 15 minutes.
Daily
Marketing platforms
Ads, analytics and email data update every day, with no manual exports.
On the roadmap
- Baseboard MCPConnect AI assistants like Claude and ChatGPT to your Baseboard data. They read your numbers and answer in plain English. Read only.Learn more
- Profit and efficiency metricsBlended POAS and Marketing Efficiency Ratio: your paid media spend measured against real profit and total business results.
- More integrationsBol.com, Amazon and WooCommerce, plus Hotjar, Snapchat Ads and Google BigQuery.
Blended metrics designed for decisions, not dashboards.
Ready to simplify your analytics?
See all your e-commerce data in one place.