Using Baseboard
The dashboard
One overview for every channel, and a card per platform for the detail behind the number.
The Overview tab
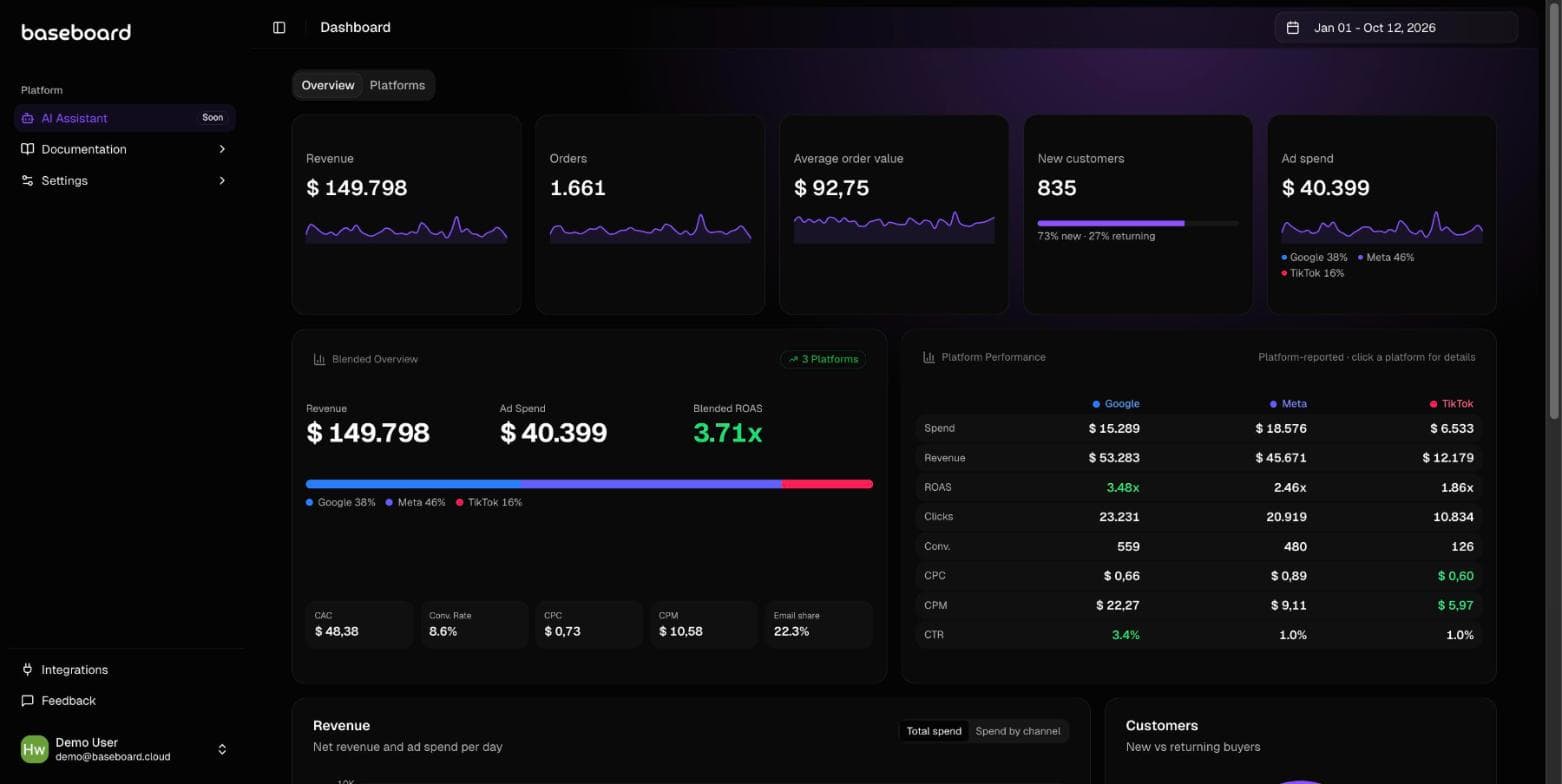
The default tab combines your platforms in one view. It starts with tiles for revenue, orders, average order value, new customers and ad spend, each with the change compared to the previous period.
- Blended overview: revenue, ad spend, blended ROAS and CAC, plus conversion rate, CPC, CPM and the share of revenue that comes from email, with the ad spend split per channel.
- Platform performance: Google Ads, Meta Ads and TikTok Ads side by side with spend, revenue, ROAS, clicks, conversions, CPC, CPM and CTR. These are the numbers each platform reports itself.
- Revenue and ad spend per day, optionally split by channel.
- New versus returning customers, top products by net revenue and sessions per channel.
The Platforms tab
Each connected platform gets its own card with four key metrics. Open the details icon on a card for the full view: campaigns and ad groups for ad platforms, orders, customers and products for Shopify, and campaigns and flows for Klaviyo. If you disconnect a platform, its card disappears.
Date range and comparisons
Pick your reporting period with the date picker in the header. Baseboard compares it with the equivalent previous period: if you choose the last 7 days, it compares with the 7 days before that, and shows the change on each metric.
Appearance
Choose an accent color under Settings, Account. Charts and highlights follow the accent you pick, in dark and in light mode.
Missing something or something unclear? Email us at contact@baseboard.cloud.