Using Baseboard
Shopify analytics
Open the Shopify card for four views: Overview, Orders, Customers and Products.
Overview
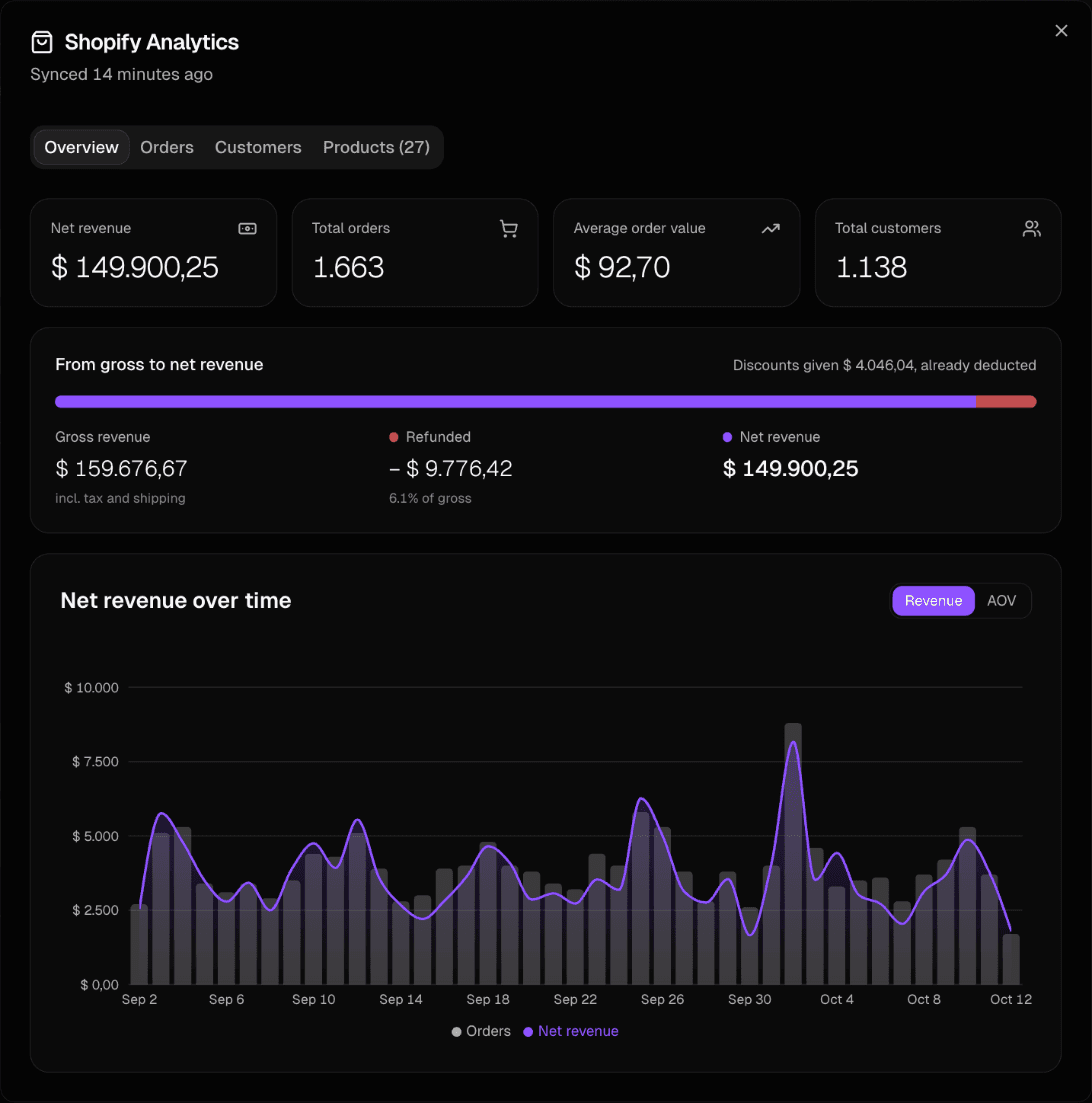
The Overview shows net revenue, orders, average order value and customers, followed by a bar that explains how gross revenue becomes net revenue: gross revenue (including tax and shipping), minus refunds, equals net revenue. Discounts you gave are already deducted from the order totals and are shown for reference.
Below that, a chart shows net revenue over time next to the number of orders. Switch it to average order value with the Revenue and AOV buttons.
Orders
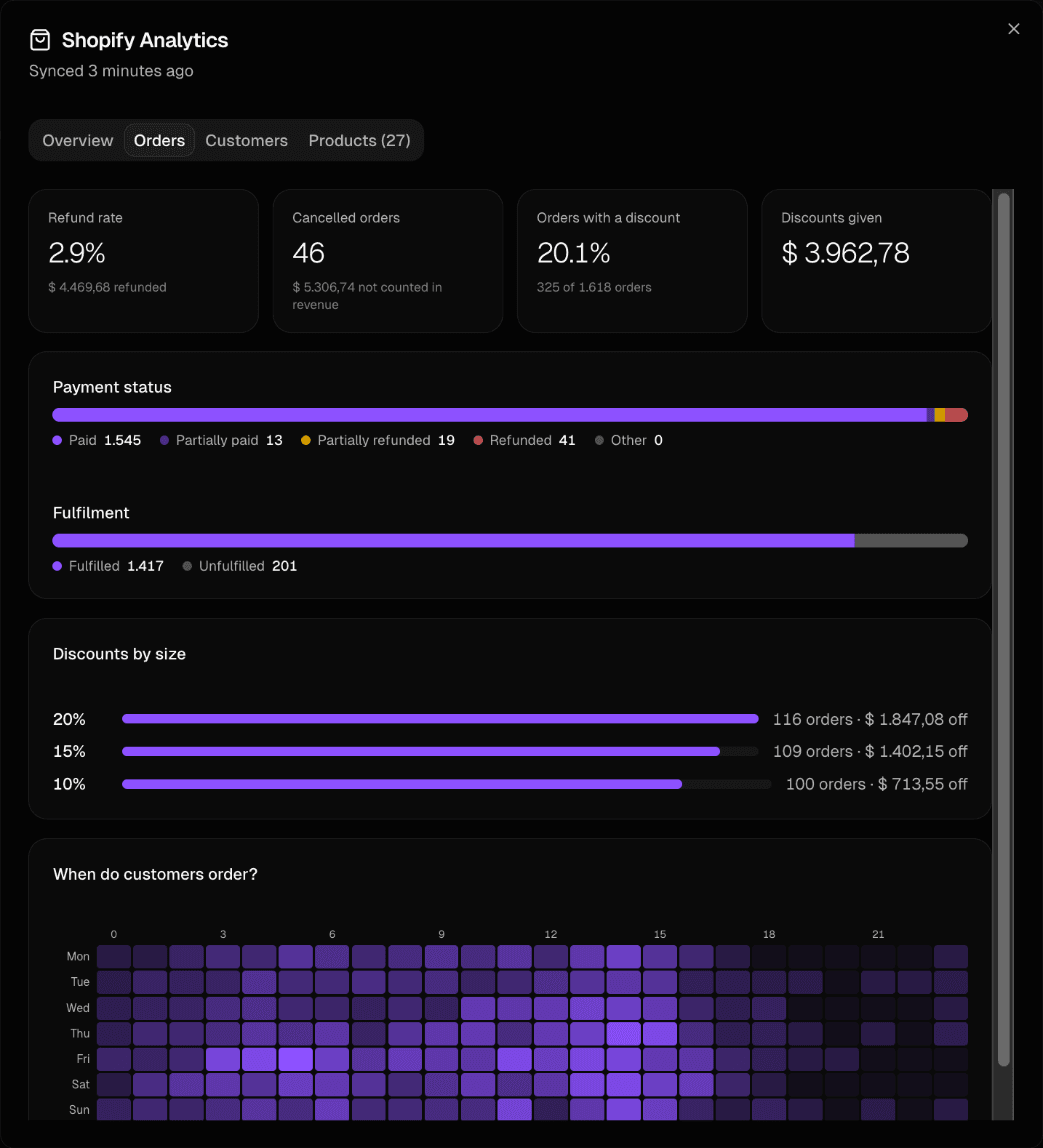
- Refund rate and the amount refunded.
- Cancelled orders and the value that is not counted in revenue.
- Orders with a discount, as a share of all orders, and the total discounts given.
- Payment status (paid, partially paid, partially refunded, refunded) and fulfilment (fulfilled versus unfulfilled).
- Discounts by size: how many orders used each discount and what it cost.
- When do customers order? A heatmap of weekdays and hours.
Customers
Customers are split into first-time buyers (one order in the selected period) and repeat buyers (two or more orders in that period). For each group you see the number of customers and orders, net revenue, average order value and revenue per customer, and what share of customers and of net revenue each group represents.
Products
A sortable table with orders, units sold and net revenue per product. The bar under each product name shows its revenue relative to your best seller.
Time zone and freshness
Days are cut off in your shop's own time zone, so the numbers line up with what you see in Shopify. Orders refresh every 15 minutes. See Data and syncing.
Missing something or something unclear? Email us at contact@baseboard.cloud.